Running Puma in AWS
This blog post was originally published on the GoDaddy Engineering Blog.
![]()
In the past couple of years, we have been on our journey to the cloud migrating our web services to AWS. In this blog post, we share what we learned about deploying Puma web server to AWS by migrating our email delivery service written in Ruby to AWS.
What is Puma?
Puma is the most popular Ruby web server used in production per the Ruby on Rails Community Survey Results. It is a fast and reliable web server that we use for deploying containerized Ruby applications at GoDaddy.
End-to-end SSL
The web components of our email delivery service run on Kubernetes. The Kubernetes service is behind an ALB Ingress Controller managed by AWS Load Balancer Controller. Every web request has end-to-end encryption in transit. Application Load Balancer (ALB) reinitializes TLS and Puma server terminates TLS in the Kubernetes pod. The Kubernetes pod is a docker container running a Ruby on Rails application with Puma.
Loading certificates from memory
When a container starts, the application initialization process retrieves the SSL certificates from AWS Secrets Manager and configures them with Puma on the fly. We contributed a change to Puma’s MiniSSL C extension to allow setting cert_pem and key_pem strings without persisting them on disk for security reasons. This new functionality is available through the ssl_bind Puma DSL and will be available in the next Puma version (> 5.5.2).
With the following sample we fetch and configure the certificate for our API component:
# config/puma.rb
config = AwsDeploy::Config.new(ENV.fetch("RAILS_ENV"))
certificate_downloader = AwsCertificateDownloader.new(config)
api_port = ENV.fetch("PORT_API")
api_cert = certificate_downloader.download("/Cert/#{config.api_host_name}")

ssl_bind '0.0.0.0', api_port, {
  cert_pem: api_cert.fetch(:cert),
  key_pem: api_cert.fetch(:key),
  no_tlsv1: true,
  no_tlsv1_1: true,
}
We run two other application components on different ports and hosts in the same Puma process using a similar config to the above.
Warmup for slow clients
We use our application-layer encryption SDK, Asherah, to encrypt all data with Personally Identifiable Information (PII) in the database. Each data row gets encrypted with a data row key, that gets encrypted with an intermediate key, then a system key, and a master key stored in AWS Key Management Service (KMS).
Asherah client initialization is an expensive operation that involves HTTP requests to AWS KMS service and database calls to retrieve the system and intermediate keys. To avoid availability issues during process restarts (deploys, daily node rotation) we have to warm up clients with slow initialization inside Puma on_worker_boot block.
on_worker_boot do
  AsherahClient.encrypt('warmup', EncryptionPartition::GLOBAL)
end
Without a warmed-up Asherah client and when there is a spike of requests during a deployment, we would experience availability problems as seen on the ALB monitoring graphs below. Warming up the Asherah client before targets get added in service resolves that issue.
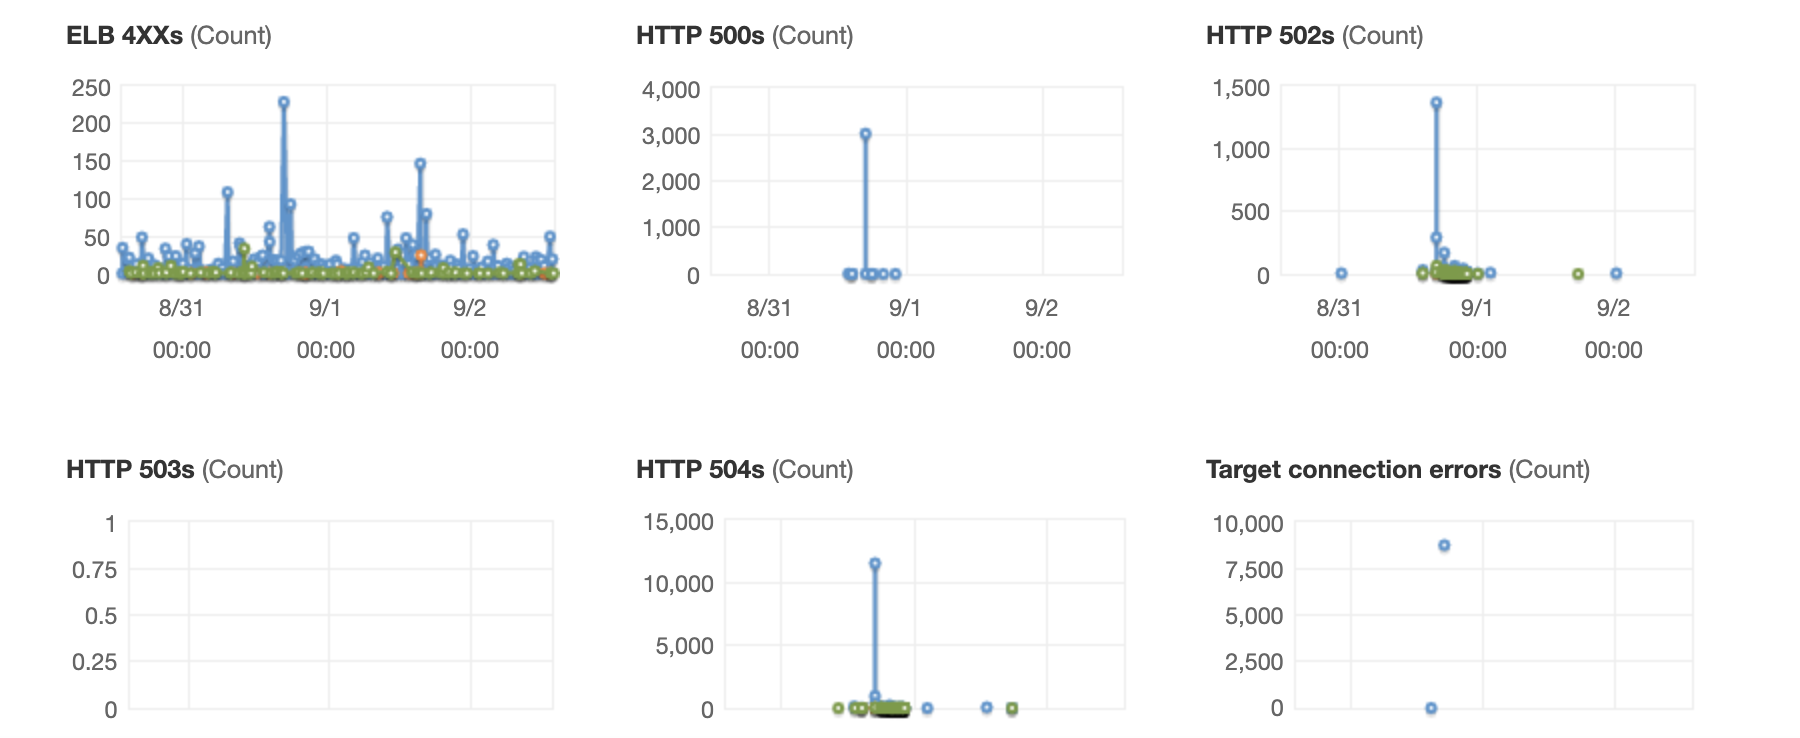
ALB monitoring
AWS Load Balancers Monitoring page gives us a good overview of incoming requests and response statuses.
We need to distinguish between status codes returned from the targets:
HTTP 2XXs(HTTPCode_Target_2XX_Count)HTTP 3XXs(HTTPCode_Target_3XX_Count)HTTP 4XXs(HTTPCode_Target_4XX_Count)HTTP 5XXs(HTTPCode_Target_5XX_Count)
and status codes generated by the load balancers:
ELB 4XXs(HTTPCode_ELB_4XX_Count)ELB 5XXs(HTTPCode_ELB_5XX_Count)HTTP 500s(HTTPCode_ELB_500_Count)HTTP 502s(HTTPCode_ELB_502_Count)HTTP 503s(HTTPCode_ELB_503_Count)HTTP 504s(HTTPCode_ELB_504_Count)
Errors generated by the targets will appear in the Exception Monitoring and/or Application Performance Monitoring (APM) systems and are easier to find and resolve than errors generated by the AWS ELB (Elastic Load Balancer).
In our experience and specific to our infrastructure setup, HTTP 500s errors are blocks coming from the AWS Web Application Firewall (WAF), HTTP 502s errors are because of TCP connection issues or SSL handshake issues, HTTP 503s errors happen when there are no targets and HTTP 504s errors are due to capacity issues i.e. when there are not enough targets.
Keep-Alive timeout
In our setup, ALB uses Keep-Alive connections with Puma and we noticed a small but consistent rate of HTTP 502s errors during quiet hours. That was happening because Puma’s default persistent timeout is 20 seconds (PERSISTENT_TIMEOUT = 20) and the ALB connection idle timeout is 60 seconds. In such quiet intervals, it happens for Puma to close the connection before ALB does and then ALB serves 502 Bad Gateway error to the client.
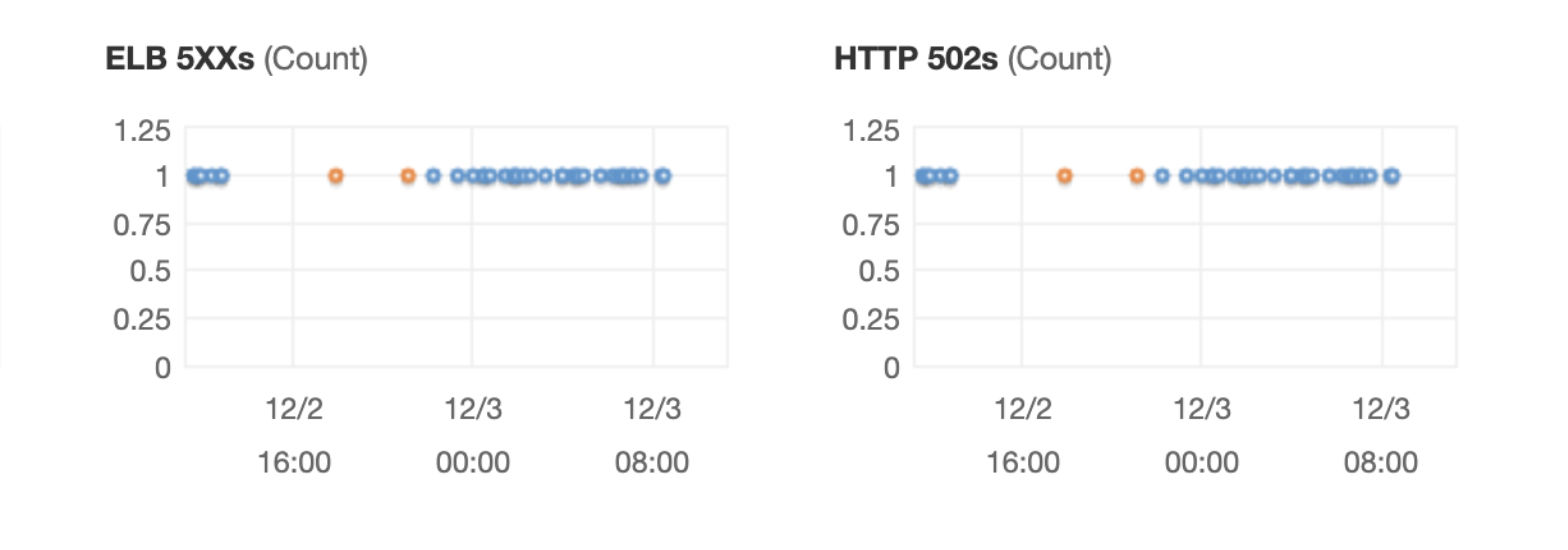
By configuring persistent_timeout for Puma to a value bigger than ALB connection idle timeout (60 seconds) + ALB connect timeout (10 seconds) we resolved that issue:
persistent_timeout(75)
Handling blasts of requests
When we send campaigns with a significant volume of recipients hosted by a single ISP, sometimes we get back a spike of web requests from the ISP that checks the links with their abuse and spam protection system. Some of the ISPs use a wide range of IPs and the AWS WAF IP rate limiting per 5-minute time span often does not catch the complete blast of requests and we get 504 Gateway timeout:
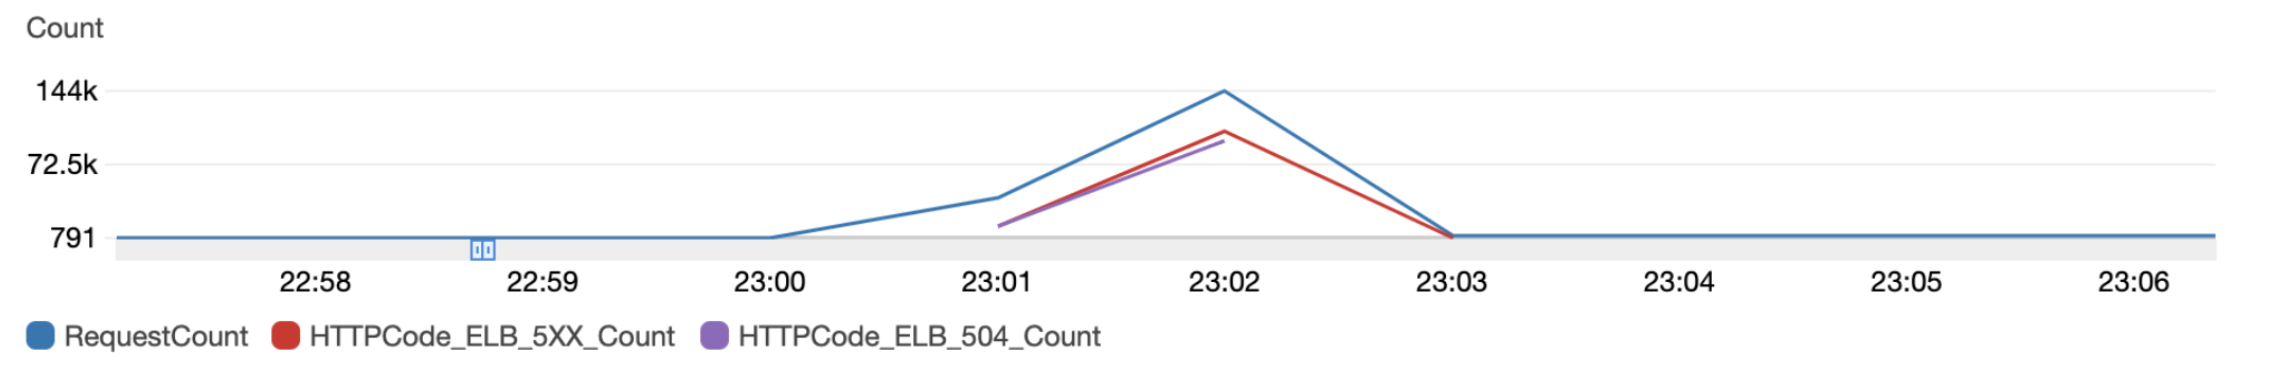
The load balancer failed to establish a connection to the target before the connection timeout expired (10 seconds).
These 504 errors are a result of open timeouts from ALB to targets i.e. requests from ALB are waiting for 10 seconds and are not able to connect to the target socket. The reason for that is some slow requests that saturate the queue and with the blast of requests the socket backlog gets full resulting in the operating system not accepting new connections. Puma allows configuring the backlog value that determines the size of the queue for unaccepted connections.
We made a change to Puma to allow setting the backlog value with the ssl_bind DSL that we use. It’s interesting that, although Puma sets the backlog size to 1024 by default, its actual value depends on the OS value for max socket connections; i.e., it is capped by the net.core.somaxconn sysctl value. We can check the system value with sysctl net.core.somaxconn or cat /proc/sys/net/core/somaxconn. On older Linux kernels (before linux-5.4) the default was set to 128 and on newer, it is 4096 (reference).
To set that with Puma’s ssl_bind DSL, we just provide the appropriate backlog value with:
ssl_bind '0.0.0.0', tracking_port, {
  # ...
  backlog: 4096,
}
In our particular case, it makes sense to increase the backlog value to prevent dropping requests while the blast of requests lasts at a cost of slightly increased latency for that short duration. That resolution came after we first evaluated capacity increase options and optimized the end-points by moving expensive operations to background jobs. These responses are in the range of 1-10 milliseconds and tools like lru_redux for in-process memory caching are extremely helpful.
Another thing to check is whether the liveness probe is the same as the readiness probe as it can worsen such high-load situations by restarting the pods. If the liveness probe is the same as the readiness probe, we can increase the failureThreshold for the liveness probe to a bigger value (10 for example).
Consider also relaxing the readiness probe in this situation by increasing its timeout. That helped us reduce errors like “SSL_read: shutdown while in init” that we were seeing for Redis connections. They seem to happen when Kubernetes takes the pod out of service due to failing readiness probes during that blast of requests, and then the ongoing requests to other Puma threads in the same process gets canceled which results in 502 errors in addition to the 504 errors.
Graceful shutdown and pod termination
When terminating a pod, Kubernetes first sends a SIGINT and, if the pod does not stop within the terminationGracePeriodSeconds, Kubernetes sends SIGKILL to forcefully stop it. When Kubernetes terminates a pod, the command to remove the endpoint from the service and the SIGINT signal execute in parallel. That could cause some requests to get dropped because the pod is terminating and that would result in 502/504 errors.
An easy way to work around that limitation and to have a greceful-shutdown is to add a sleep interval before the Puma process stops. To achieve that we use a preStop hook and, in our testing, we landed on a sleep interval of 40 seconds that is enough time for Kubernetes’ Endpoints Controller async reaction and for kube-proxy to update iptable rules. We are also increasing the terminationGracePeriodSeconds to 70 seconds that applies to the total time (both PreStopp hook + container stop) to allow for 30 seconds for Puma to process queued requests before it receives SIGKILL.
terminationGracePeriodSeconds: 70
containers:
  - name: {{ include "application.apps.name" . }}
    image: {{ include "container.image" . }}
    args: ["bundle exec puma"]
    lifecycle:
      preStop:
        exec:
          command: ["sh", "-c", "sleep 40"]
Puma stats and auto-scaling
Queue Time is an important metric to monitor and should feed into the auto-scaling configuration. But, AWS ALB does not provide the X-Request-Start header and we cannot calculate the queue time dynamically. We can enable, download and parse load balancer access logs to calculate queue time after the fact like this:
queue_time = time - request_creation_time - request_processing_time - response_processing_time - target_processing_time
We need a dynamic value to use for auto-scaling, and we can calculate the Puma business metric using the following formula:
puma_business = (1 - sum(pool_capacity) / sum(max_threads)) * 100
These Puma values used in the calculation are available from Puma.stats:
{
  "started_at": "2021-12-27T15:19:09Z",
  "backlog": 0,
  "running": 3,
  "pool_capacity": 4,
  "max_threads": 5,
  "requests_count": 6
}
Load balancing
In regards to load balancing, we need to consider whether to run Puma in single or cluster mode. The advantage of Puma cluster mode is that it can better deal with slow, CPU-bound responses because the queue is shared between more than one worker. Puma will route requests to worker processes that have the capacity, yielding better queue time.
AWS ALB supports the Least Outstanding Requests algorithm for load balancing requests in addition to the default, Round Robin algorithm. The Least Outstanding Requests algorithm is not ideal in case there is a problematic pod that quickly returns error responses and all upcoming requests gets routed to it unless we have quick health checks to react to the falling target.
Conclusion
Deploying Puma and tuning its performance to adequately provision resources involves lots of details to consider and analyze. Warming up slow clients, tuning keep-alive timeouts, graceful shutdowns, and optimizing the backlog queue size are essential to ensure the service can respond to high loads with minimal latency and without interruption. Loading SSL certificates directly from Secrets Manager, end-to-end SSL encryption in transit, and implementing application-layer encryption are required to secure customer data in the cloud. Monitoring for Puma metrics, in addition to ALB monitoring, would be great to have. We’ll be exploring using Prometheus for monitoring Puma metrics and configuring auto-scaling based on the Puma business metric. In the lack of such monitoring, analyzing access logs could bring useful insights and ideas on what to tweak next.
